Sound nutritional status is a fundamental requirement for good health. This is achieved by eating a healthy balanced diet which supplies nutrients to meet the requirements of the body throughout life. So in essence a case of supply to meet demand and individual demands will differ dependent on age, sex, physical activity, pregnancy, trauma, illness.
A healthy balanced diet is one which consists of protein, carbohydrate, fat, fibre, vitamins, minerals and water. It’s important to recognise that malnutrition, or poor nutritional status, can occur as a result of eating an excess of nutrients as well as eating too few nutrients. For example, it’s likely an individual whose diet consists mainly of burgers, fries and pizza but limited amounts of fruit and vegetables will be deficient in one or more vitamins leading to suboptimal health.
To protect the health of the population the UK government provide a series of guidelines for nutritional requirements, including the macronutrients carbohydrate, protein and fat and micronutrients, vitamins and minerals. Grouped together under the umbrella term ‘Dietary Reference Values’ (DRVs), they cover estimates of energy and nutrients for healthy population groups, i.e. children of varying ages, teenage and adult males, teenage and adult females and pregnant/breast feeding adult females.
DRVs include Reference Nutrient Intakes (RNIs), Estimated Average Requirements (EARs) and Lower Reference Nutrient Intakes (LRNIs). A normal population distribution curve, see Figure 1 below, shows that…
- EARs are likely to meet the needs of 50% of the population, whilst the requirements of others will group around the median point and be slightly less or slightly more than the EAR
- RNIs will be sufficient for almost all of the population (97.5%) and would likely exceed the requirements of most people
- LRNIs would be sufficient for only 2.5% of the population, i.e. individuals with low requirements
Figure 1: Frequency distribution of population dietary requirements
DRVs were published for all nutrients and energy in a 1991 report issued by COMA (Committee on Medical Aspects of Food and Nutrition Policy) which is linked here. There are similar definitions in use in other countries. As an example, Figure 2 below gives the DRVs for iron as detailed in the 1991 report.
Figure 2: DRVs for iron in milligrams per day
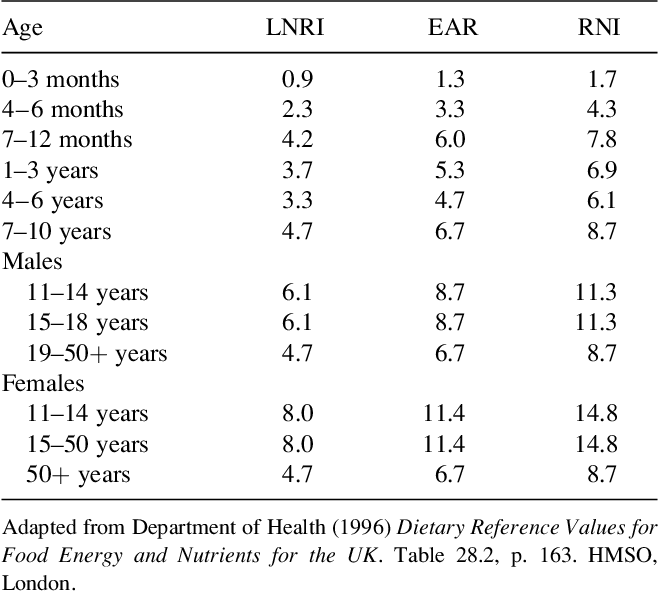
COMA were keen to stress that the DRVs were estimates of nutrients and energy needed at a population level and should not be seen as recommendations or goals for individuals to aspire to. Instead other bodies use and interpret these guidelines and produce food-based recommendations for the general population, e.g. food labelling (covered in more detail below) and pictoral representations such as The Eatwell Guide (see the post ‘Plating it up’).
COMA has been superceded by SACN (Scientific Advisory Committee on Nutrition) and SACN have revised certain aspects of the original 1991 report. Guidelines for energy were updated by SACN in 2011, sugar and fibre were updated in 2015 and vitamin D in 2016.
A summary of the government guidelines in tabular format is linked here.
Nutrition labelling on pre-packaged food
There is strict legislation in the UK and other countries on the labelling of pre-packaged food. For example, a list of ingredients is required and these should be provided in descending order by weight. To call a burger a ‘beef burger’ it must contain at least 62% meat by weight. More can be found on these types of legislation in the post ‘Setting Standards’.
Here the focus is primarily on ‘back of pack’ nutrition labelling, which since December 2016 has been compulsory on most pre-packaged food and ‘front of pack’ nutrition labelling.
Back-of-Pack Nutrition Labelling (see Figure 3 below)
The mandated detail required per 100g, 100ml, or per food portion/unit, e.g. one biscuit, is:1
- energy in kilojoules (kJ) and kilocalories (kcal)
- grams (g) of fats, saturates (saturated fat), carbohydrates, sugars, protein, salt
Other voluntary information that may be included extends only to the following:1
- monounsaturated fats
- polyunsaturated fats
- polyols (sugar alcohols found naturally in certain fruit and vegetables and often added to foods as sweeteners, e.g. sorbitol)
- starch
- fibre
- vitamins and minerals when present in significant amounts
- the amount of a substance that has been declared in a nutrition or health claim, e.g. omega-3 if there is a health claim ‘high in omega-3’
Figure 3: Back-of-Pack nutrition labelling – an example
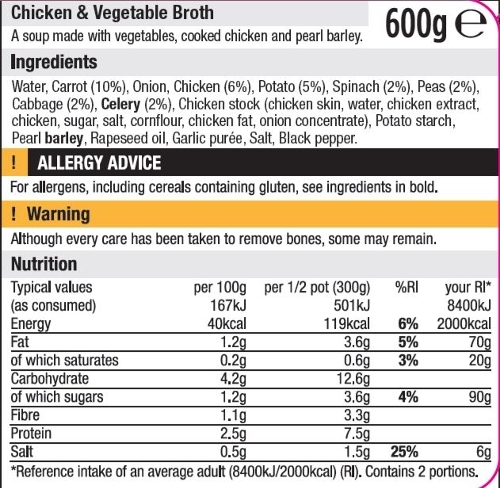
Source: British Diabetic Association
Front-of-Pack Nutrition Labelling (see Figure 4 below)
This is voluntary and aims to provide at-a-glance information on the following nutrients given by 100g, 100ml, and/or per portion/unit:1
- energy (KJ and kcal)
- fat (g)
- saturates (g)
- sugars (g)
- salt (g)
If choosing to show all of the above by portion/unit then energy content should also appear per 100g/100ml
Figure 4: Front-of-Pack nutrition labelling – an example showing the traffic light colour coding
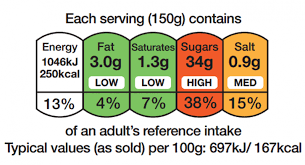
Source: British Nutrition Foundation
Reference Intakes
To further inform healthy food choices, reference intakes may also be included on nutrition labels. These are used as a benchmark or guide to the amounts of energy and nutrients which should be consumed on a daily basis. See Figure 3 above, where these are shown.
They are based on the requirements of an average-sized adult female who engages in an average amount of daily physical activity. If added to the nutrition label they should be shown as a percentage per 100g/100ml and/or per portion/unit. The maximum daily reference intakes for an adult are:
Energy – 8,400kJ/2000kcal
Total fat – less than 70g
Saturates – less than 20g
Carbohydrate – at least 260g
Total sugars – 90g (this includes intrinsic sugar in milk, fruit and vegetables as well as added sugars)
Protein – 50g
Salt – less than 6g2
Tips
A manufacturer’s portion size may differ from your own. If in doubt, weigh out a portion size and see how this compares with what you would usually serve.
If comparing products in a supermarket, use the traffic light colour coding and choose items which have more greens and ambers than reds.
References
- Department of Health (2016). Technical Guidance on Nutrition Labelling. Available from: https://assets.publishing.service.gov.uk/government/uploads/system/uploads/attachment_data/file/595961/Nutrition_Technical_Guidance.pdf
- NHS (2020). Reference Intakes Explained. Available from: https://www.nhs.uk/live-well/eat-well/what-are-reference-intakes-on-food-labels/