What is it?
Initially developed by Dr David Jenkins in the early 1980’s to assist with dietary choices for diabetics1, the glycaemic index (GI) ranks foods which contain carbohydrates according to their effect on the concentration of glucose in the blood, otherwise known as glycaemia.
Because foods which mainly consist of protein and fat have little effect on blood glucose levels, for example, meat, fish, and eggs, these are not included in the index.
How is it measured?
Figure 1 illustrates the effect on blood sugar levels over a two-hour period following ingestion of a test food containing 50g of available carbohydrate, for example carrots*, measured against 50g of carbohydrate in a known reference food with a high GI, usually glucose. The ‘area under the curve’ is measured for each food source and the GI is calculated for the test food as shown below. Generally, the results for 10 or more individuals are averaged to give the resulting GI.
Figure 1: Measuring the area under the curve
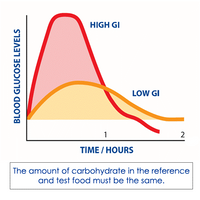
Source: British Diabetic Association
Glycaemic Index =
Area under the curve (Test food) X 100
Area under the curve (Reference food)
What practical applications does the GI index have?
The rankings in the index range between 0 and 100, where 0-55 represents a low GI food, 56-69 a medium GI food and 70-100 a high GI food2. Pure glucose arbitrarily has a GI rank of 100.
Products of digestion begin making their way into the bloodstream 15 to 30 minutes after a meal. With high GI foods, blood glucose levels will ‘spike’ quite soon after the food is eaten, as shown in Figure 2. In response to a rise in blood glucose, there will be a concomitant rise in blood insulin levels. Insulin, a hormone produced by the pancreas, brings about a lowering of the concentration of glucose in the blood by facilitating its movement into muscle cells and the liver where it is used for energy/stored as glycogen, or into fat cells (adipose tissue) to be stored as fat. High GI foods could be of use if you were looking for an energy boost during exercise.
Lower GI foods have a less dramatic effect on the blood glucose spike. In this case, levels of glucose in the blood rise more slowly so the corresponding need for insulin to move the glucose out of the blood stream is lower. Consequently, low GI diets are believed to reduce insulin resistance3,4, a major cause of type 2 diabetes.
Figure 2: How low, medium and high GI foods affect blood glucose levels over time
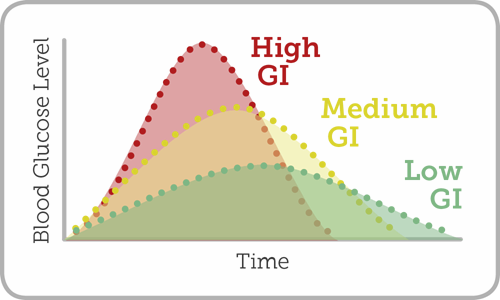
Source: Know Diabetes
What limitations does the GI index have?
It is important to note that the GI values of foods are calculated as if the food were eaten on its own. This could be of use if you snacked on an apple or a serving of ice cream for example and were keen to understand how each could affect your blood glucose levels. However, most meals will contain a variety of foodstuffs, so GI values should be considered in the context of a healthy, balanced diet. This could include choosing lower GI alternatives such as new potatoes with their skins in preference to white mashed potato, wholegrain or seeded bread rather than white bread and brown rice instead of white rice.
Another key fact is that low GI foods are not always healthy. Chocolate cake has a lower GI primarily because it has a high fat to carbohydrate content, so less carbohydrate and lower GI, but is calorie dense and of little nutritional value.
*Referring back to the section above on how the GI is calculated for carrots containing 50g of carbohydrate – with around 6g of carbohydrate in 80g of carrots (https://glycemicindex.com), one would need to eat in the region of 650g of carrots (a lot of carrots) to achieve a carbohydrate intake of 50g from carrots alone.
To take account of the ‘650g of carrots’ issue, the concept of glycaemic load (GL) was introduced which gives a rating according to portion size. On a scale between 0 and 20+, 0-10 represents low GL, 10-19 medium GL and =>20 high GL (https://glycemicindex.com). Two small, raw carrots would have a GL of around 8.
We’re also all individuals, so the GI of a foodstuff is likely to vary from one person to the next.
If you would like to delve further into this topic, a wealth of information together with a comprehensive database of foods and their GI and GL values, has been compiled by the University of Sydney at this link https://glycemicindex.com
References
- Jenkins, DJ; TM Wolever; RH Taylor; H Barker; H Fielden; JM Baldwin; AC Bowling; HC Newman; AL Jenkins; DV Goff. Glycemic index of foods: a physiological basis for carbohydrate exchange. American Journal of Clinical Nutrition (1981), 34(3), 362–66. Available from: doi:10.1093/ajcn/34.3.362
- Brand-Miller, J., Wolever, T.M., Foster-Powell, K., Colagiuri, S. The New Glucose Revolution. New York: Marlowe & Company, 2003
- Bjorck, I, Liljeberg, H., Ostman, E. Low glycaemic-index foods. British Journal of Nutrition (2000), 83, Suppl. 1, S149–S155
- Radulian, G., Emilia Rusu, E., Andreea Dragomir, A., Posea, M. Metabolic effects of low glycaemic index diets. Nutrition Journal (2009), 8 (5). Available from: doi: 10.1186/1475-2891-8-5