Sugars occur naturally in fresh foods like milk, fruit and vegetables, making them taste sweet and palatable. The sugars added to processed foods by manufacturers are known as free sugars and have a number of other functions, for example to extend shelf life, to enhance texture, to add caramelisation and to decorate. In the UK these sugars are listed on the nutrition label as ‘carbohydrates (of which sugars)’ (see Figure 1), although this data can include naturally occurring sugars in the product as well as free sugars.
Figure 1: Example of a UK nutrition label
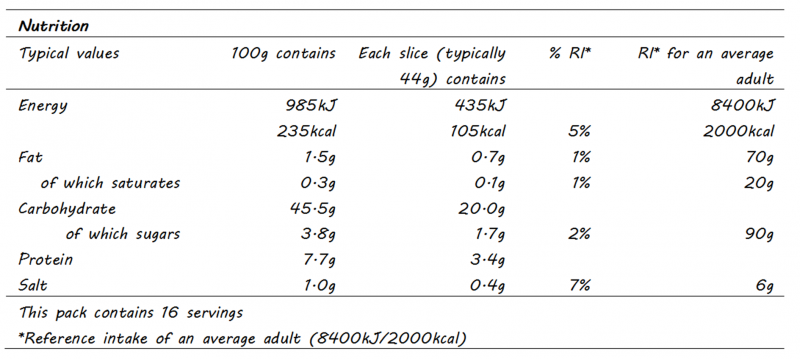
Source: British Nutrition Foundation
For added comfort you may want to scan the ingredients list of the product to see if extra sugars have been used during processing and this is where it could get tricky. There are somewhere in the region of sixty different names for the types of sugar that manufacturers can add during food processing1,2 – things like maltodextrin, dextran, sorghum, fruit concentrate, which to the layman does not shout out that it is actually sugar.
What are free sugars and why we should be consuming less
The World Health Organisation (WHO)3 defines free sugar as ‘monosaccharides and disaccharides added to foods by the manufacturer, cook or consumer, and sugars naturally present in honey, syrups, fruit juices and fruit juice concentrates’. In 2015, to reduce the incidence of overweight, obesity and dental caries but excluding anyone on a therapeutic diet regime, the WHO strongly recommended a reduction in the amount of free sugar consumed by adults and children to <10% of their total energy intake, with a conditional recommendation that this was further reduced to <5% of total energy intake. Intrinsic sugars – found within the intact cellular structure of fruit and vegetables – and those naturally present in milk and milk products (lactose) were exempted from the recommendations.
Due to emerging evidence the UK government had already asked the Scientific Advisory Commission on Nutrition (SACN) to investigate the relationship between dietary carbohydrates and health. In July 2015, SACN published their findings, recommending the average intake of free sugars should not exceed 5% of total dietary energy, which equates to:
- 19g (5 sugar cubes) for children aged 4 – 6 years
- 24g (6 sugar cubes) for children aged 7 – 10 years
- 30g (7 sugar cubes) for ages 11 years and above 4
In the same report and using results from randomised control trials with children and adolescents, SACN also reinforced the indisputable claims that sugar sweetened beverages are to be held accountable for weight gain and increased BMI in these age groups and more generally increasing the risk of developing type 2 diabetes. Undoubtably there is a recurring theme around the use and adverse health effects of the beverage sweetener high fructose corn syrup, and the high fructose content of fruit juices5, particularly when these beverages are consumed to excess.
Fructose – the villain?
Fructose is one half of the dissacharide sucrose, the other is glucose. Metabolism of glucose is dependent on the hormone insulin which mediates the uptake of glucose by cells in the body where it is used to produce energy. Fructose on the other hand is metabolised in the liver. There is a body of opinion that fructose, when consumed in large quantities, may promote the development of Non-Alcoholic Fatty Liver Disease (NAFLD)7 and contribute to a range of major health issues from addiction to metabolic syndrome6.
This movement began in the early 1970’s when a UK professor, John Yudkin, published his book, ‘Pure, White and Deadly’8. He highlighted the fact that sugar consumption had tripled since the end of World War II, that 1/4 of UK adults at that time were overweight and in the diets of wealthier nations, sugar constituted 1/6 of energy intake. Yudkin proposed there was enough epidemiological evidence to suggest sugar raised serum triglyceride and cholesterol levels and could be one of the causative factors of coronary heart disease (CHD). However, by the end of the 1970’s the low-fat diet had risen to prominence, Yudkin’s work was discredited and his book went out of print.
Fast forward thirty+ years, with larger studies and more data, a resurfacing of Yudkin’s approach was again beginning to show that sugar was the primary force behind the impaired composition of lipid levels in the blood and CHD. Although this time it was also known that a subclass of low density lipoprotein (LDL) called small density LDL (sdLDL) had greater propensity for the development of atherosclerotic plaques* in CHD compared to the other LDL subclasses9.
*a build-up of fat, cholesterol and other substances in/on artery walls, causing narrowing of the artery
Fructose – opposing arguments
Alternative sources suggest these arguments are exaggerated10. This is because the studies largely tended to be short term with participants consuming extremely high quantities of fructose, in the region of 20% to 25% total energy intake, compared to the average intake in the UK and US of around 12%. However, one intervention target that has arisen from the data are children and adolescents. It has been affirmed this group are indeed consuming around 20% of their energy intake from free sugars and may suffer adverse metabolic effects because of this.
In the future results from more longer term studies may provide a clearer picture on the potential harmful effects of excess fructose in our diet.
References
- Secret Sugars: The 56 different names for sugar. Virta Health, 2018 [viewed 31 March 2021]. Available from: https://www.virtahealth.com/blog/names-for-sugar
- Added Sugar vs Natural Sugar. That Sugar Movement, 2015 [viewed 31 Much 2021]. Available from: https://thatsugarmovement.com/added-sugar-vs-natural-sugar/
- World Health Organisation. Guideline: sugars intake for adults and children. March 2015. [viewed 31 March 2021]. Available from: https://www.who.int/publications/i/item/9789241549028
- Scientific Advisory Commission on Nutrition (SACN). Carbohydrates and Health, 2015 [viewed 31 March 2015]. Available from: https://www.gov.uk/government/publications/sacn-carbohydrates-and-health-report
- Popkin, B.M. and Hawkes, C. The sweetening of the global diet, particularly beverages: patterns, trends and policy responses for diabetes prevention. The Lancet Diabetes & Endocrinology [online]. HH Public Access. Feb 2016, vol. 4(2). pp 174-186 [viewed 31 March 2021]. Available from: DOI 10.1016/S2213-8587(15)00419-2
- Lustig, R.H., Schmidt, L.A., Brindis, C.D. The toxic truth about sugar. Nature 482, 2012. pp 27-29 [viewed 31 March 2021]. Available from: DOI 10.1038/482027a
- Samuel, V.T. Fructose induced lipogenesis: from sugar to fat to insulin resistance. Trends in Endocrinology & Metabolism [online]. CellPress. Feb 2011, vol. 22(2). pp 60-65 [viewed 31 March 2021]. Available from: DOI 10.1016/j.tem.2010.10.003
- Yudkin, John. Pure, White and Deadly. London: Penguin, 2012
- Ivanova, E.A., Myasoedova, V.A., Melnichenko, A.A., Grechko, A.V., Orekhov, A.N. Small Dense Low-Density Lipoprotein as Biomarker for Atherosclerotic Diseases. Oxidative Medicine and Cellular Longevity [online]. May 2017, 2017:1273042. [viewed 1 April 2021]. Available from: DOI 10.1155/2017/1273042.
- Lanham-New, S.A., ed., Hill, T.R., ed., Gallagher, A.M., ed., Vorster, H.H., ed. (2020). Introduction to Human Nutrition. 3rd ed. UK: Wiley Blackwell, pp. 215